
- The Zero Spread is providing a signal of the building risk of an economic recession.
- A substantial lag exists between yield curve inversion and a recession, and a key spread has to still turn negative.
- Federal Reserve timely dovish stance and perhaps even aggressive steps can prolong the expansion, along with a globally stimulative environment.
- Historically, stocks have performed well and continued with the uptrend following a yield inversion, and we may be entering a strong and perhaps even a steady phase higher.
- Calibrating stock portfolio exposure makes more sense than completely avoiding stocks as the market adjusts to a new set of slower growth data.
The Curse of The Zero Spreads
investors on Friday were jolted by the market pullback triggered by an economic indicator with a steady record of predicting recessions. The Nasdaq (QQQ), S&P 500 (SPY), Dow Jones (DIA), and the Russell 2000 Small Cap (IWM) indexes retreated 2% to 4%. The indicator is the spread between the interest rates of two bonds, and there are different kinds of spread indicators. The one with a longer lead time is considered to be the 2-year and 10-year treasury bond spread or 2/10. Another one, the 3-month/10-year or 3/10 is also considered to have a good track record, and it’s this 3/10 spread that became zero last Friday, ringing alarm bells of an impending recession.
Typically, a spread between a short and long duration instrument reaches zero in anticipation of an economic recession, which puts downward pressure on longer-term yields. At the same time, the short-term interest rates remain constant, edge higher, or drop much slowly, reflecting the current monetary policy. This causes a crossover referred to as a yield inversion or zero/negative spread.
The spread indicator has been a reliable harbinger of recessions in at least the last three instances. However, the spread indicators are not very helpful in terms of narrowing the timing of when the recession will begin. In the past three recessions, the most reliable 2/10 spread indicator reached zero or turned negative, 19 months, 33 months, and 24 months before the official onset of a recession. Since mid-seventies, covering 5 recessions, the fastest time to a recession has been 10 months, and that was during the back-to-back recessions of 1980 and 1981. So zero spread indicator is not a meaningful market timing indicator.
The 2/10 Spread Not Yet Zero, And It Usually Leads
It must be pointed out that the 2/10 indicator has not turned 0 yet, and remains very close to that level. It is important that the 2/10 spread confirms the upcoming recession signal too.
Below we have taken the two key spread indicators and overlaid them.
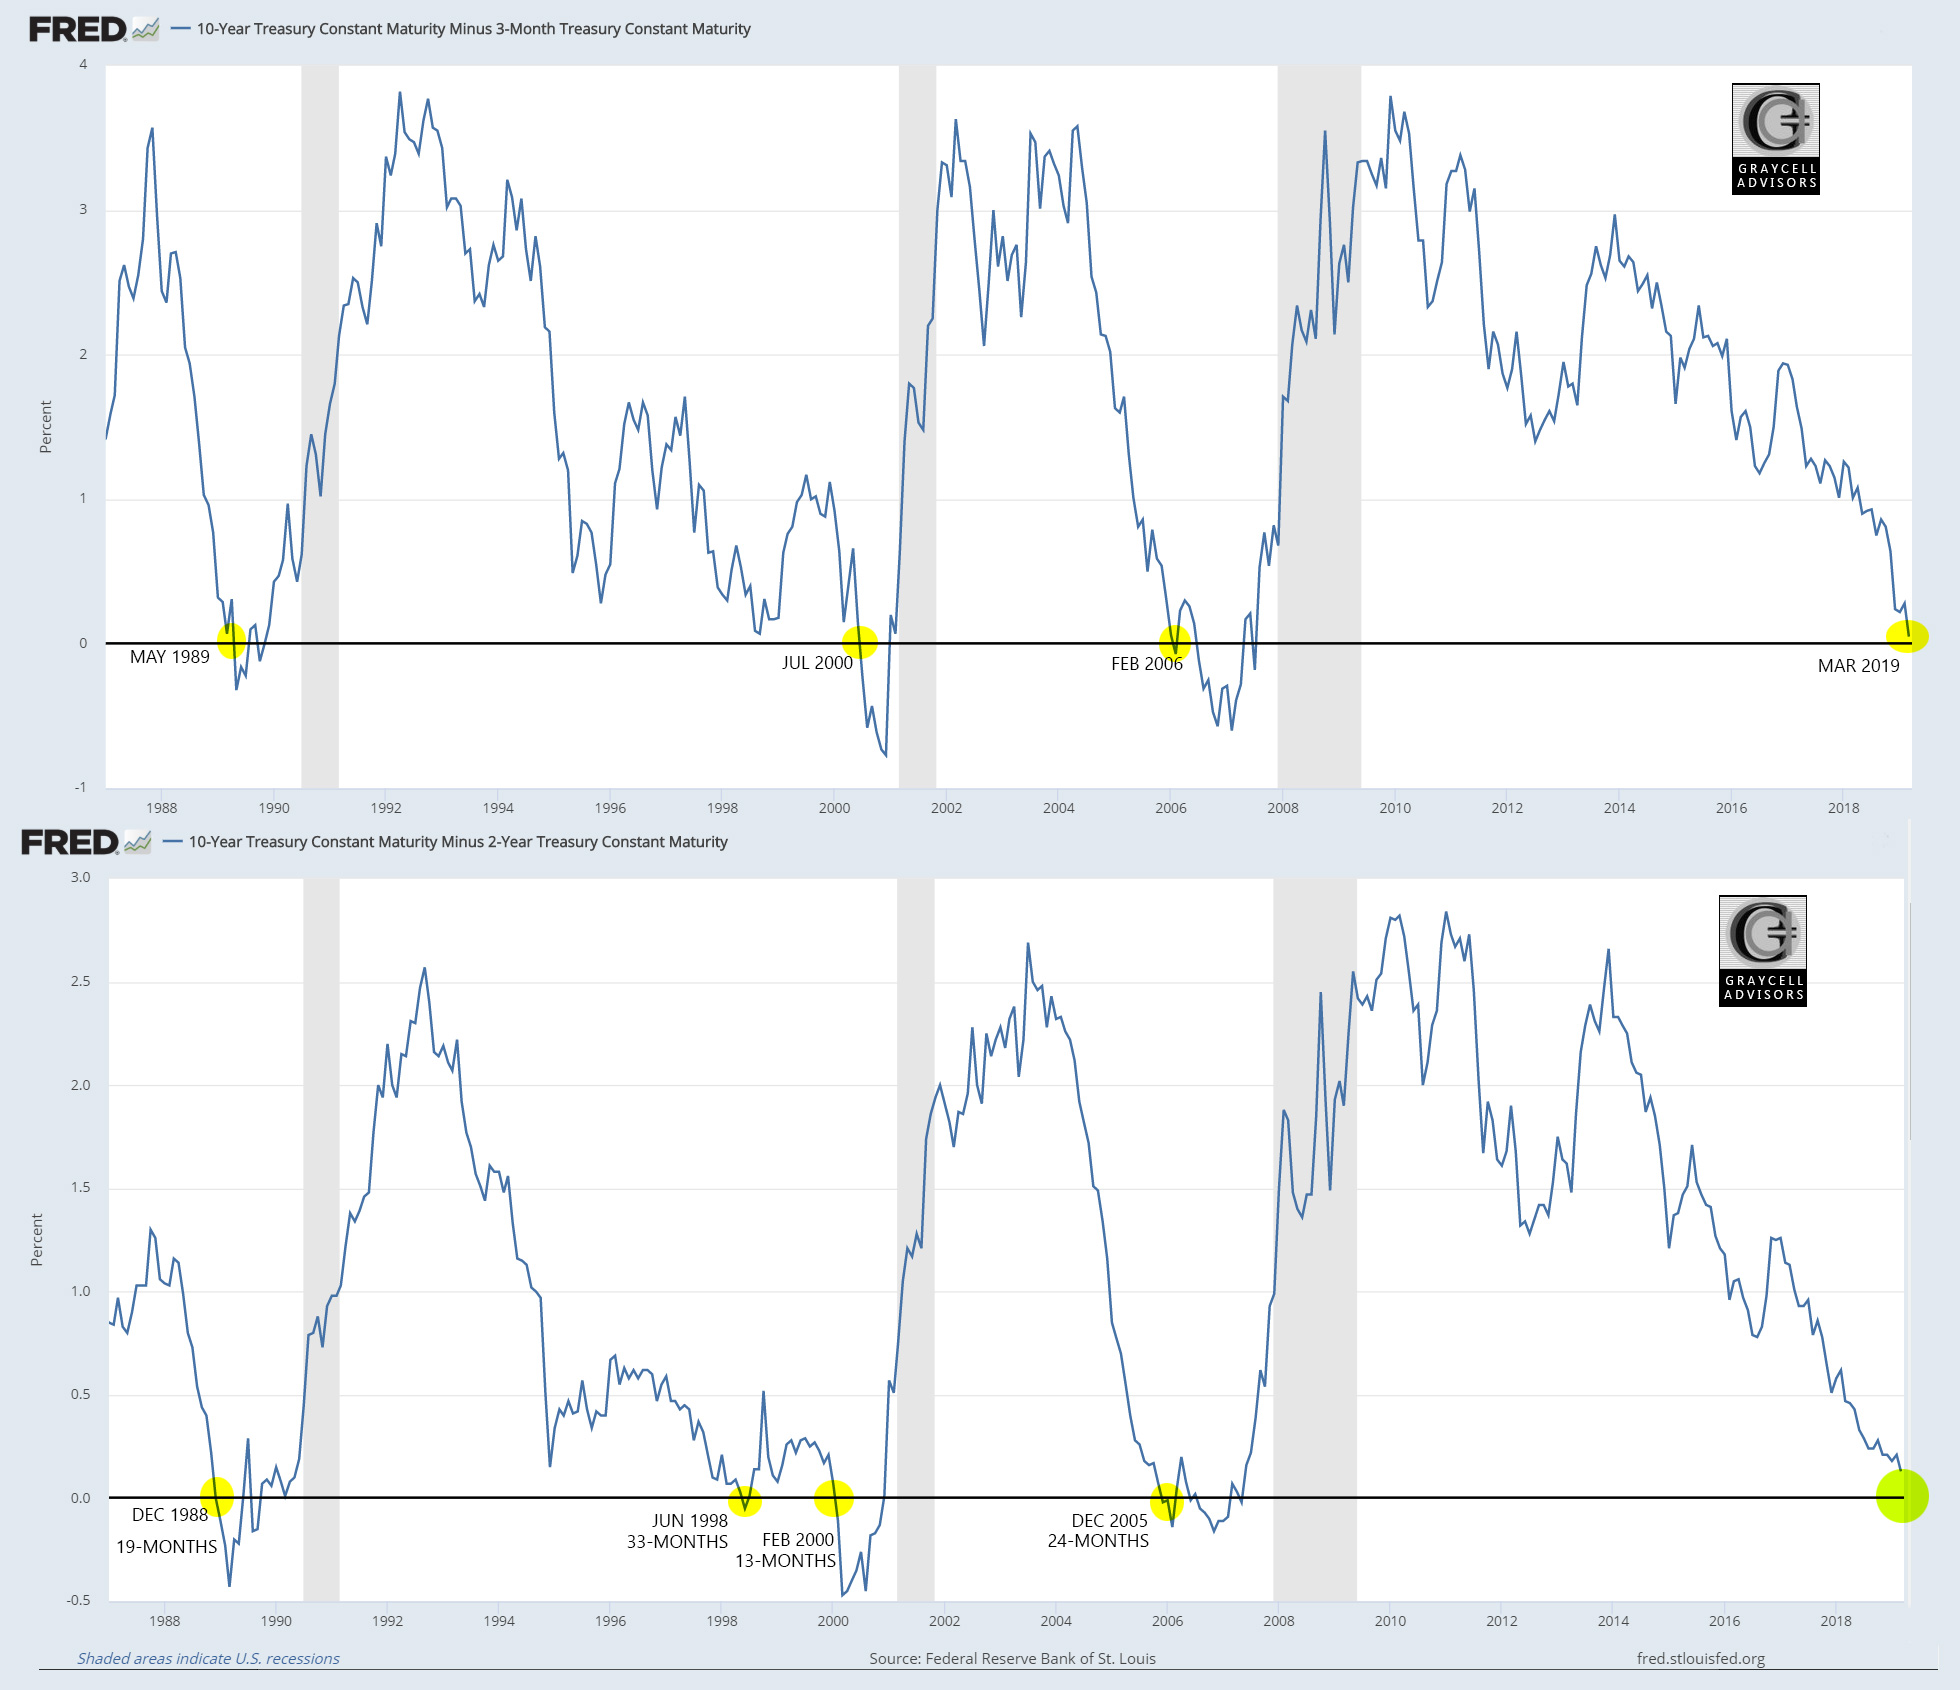
Spreads: 3-month/10-Year Chart Vs 2-Year/10-Year Chart ~ Source: FRED, edits by Graycell Advisors
In the illustration above, the top chart is the 3-month/10-year spread, while the bottom one is the 2-year/10-year spread. All crossover or zero spread points are highlighted in yellow color and labeled with the month and year. In the second chart of 2/10 spread, we have shown the number of months before the recession began after the spread turned 0 or negative.
As the 3m/10y spread chart shows, it touched 0 last Friday. While the green highlight on the 2y/10y chart shows that the spread has not yet turned negative.
An interesting insight is revealed when one looks at the dates when the spreads turned negative for both the charts. In the past 3 recessions, it is always the 2/10 spread that has turned negative first and that too, months ahead before the 3m/10y spread. In other words, the 2/10 has always led the shorter-term 3/10 spread in tolling the bell for an upcoming recession.
What happened last week is the first time, since the data is available from mid-seventies, that the 3m/2y spread has turned negative before the 2/10 one. It's an interesting departure from historical data.
How much weight to put into this anomaly?
That's a matter of opinion.
But perhaps, technical considerations, like the heavy issuance of shorter-term treasury bills over the past 6 months, has raised short-term yields while at the same time the longer-term yields are melting after the Federal Reserve's recent cautious commentary.
In other words, technical considerations may have pushed the spread to zero. Of course, this will be a moot point about an upcoming recession if the 2/10 spread turns negative too in the coming days.
What Do Stocks Do When Spreads Turn Negative
Based on a study of the last 3 yield inversion and recessions, stocks typically continue with their uptrend or go through a short period of adjustment, measured in just a few weeks, and then resume their uptrend.
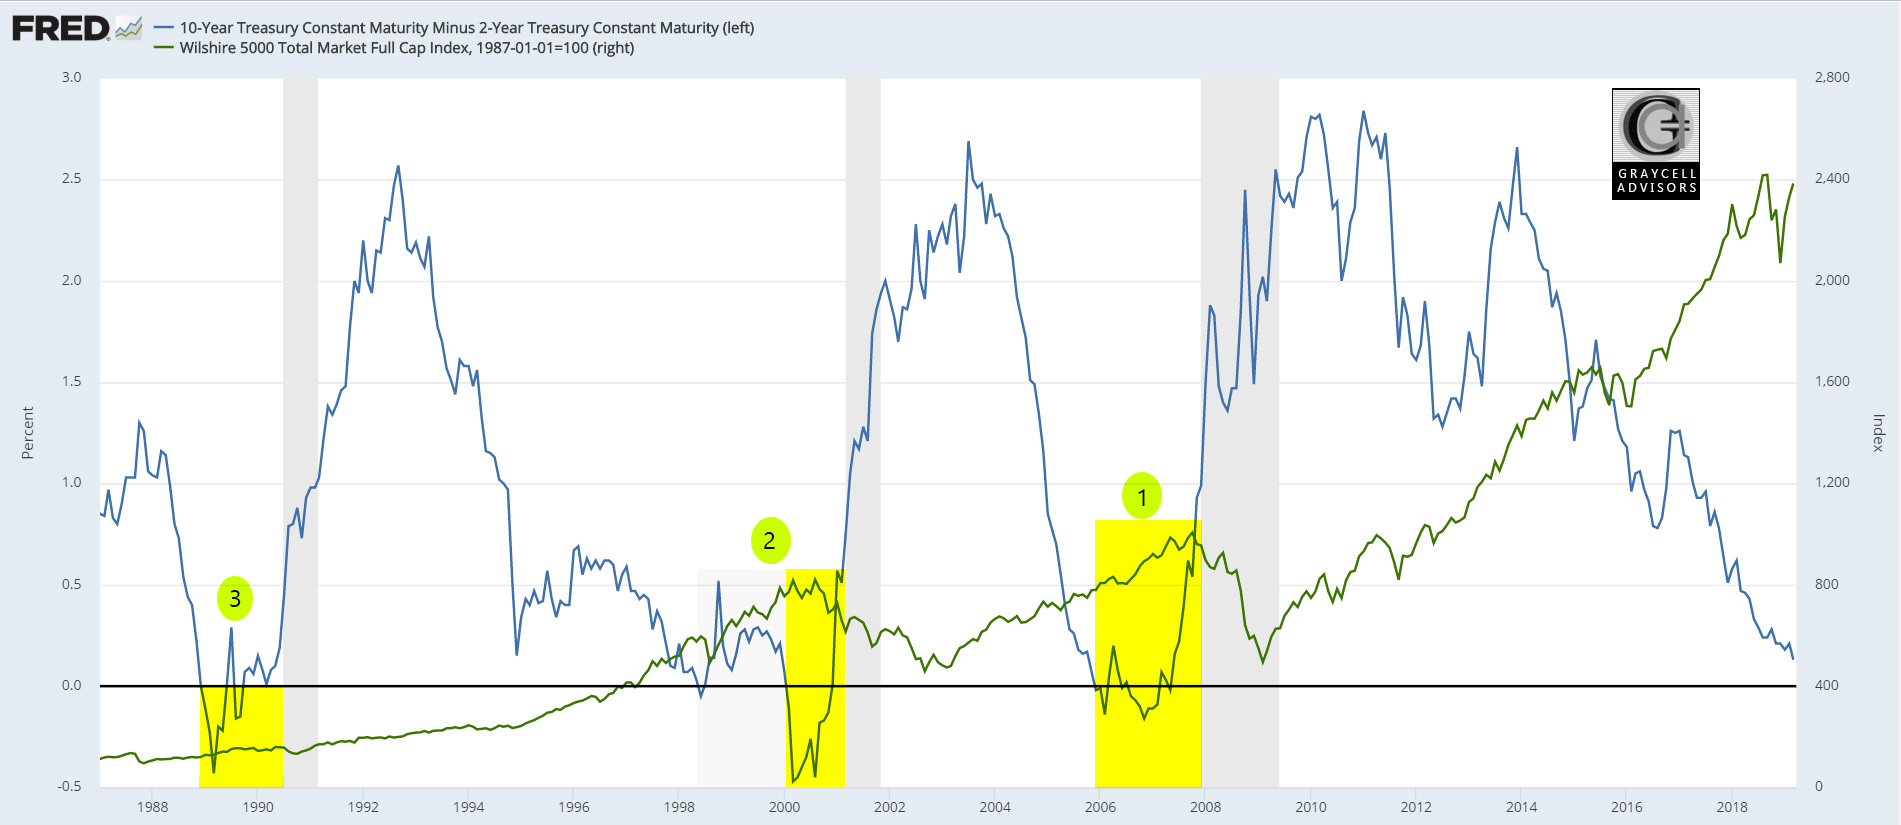
Yield Inversion and the Stock Market ~ Source: FRED; edits by Graycell Advisors
As the chart above illustrates, prior to the Great Recession in 2007-2008, labeled as 1 on the chart, stocks simply continued with their uptrend in December 2005 when the 2/10 spread turned negative. The broader uptrend continued until just a couple of months before the onset of the recession in November 2007.
In the prior 2001 recession, marked as 2, stocks continued to move higher after the spread turned negative and then ran into a pullback, before resuming the uptrend again which continued till a couple of months before the onset of the recession.
Going back even further, the 1990 recession, marked as 3, witnessed the stocks continue higher with no meaningful pullback or adjustment period after the spread turned negative. The uptrend continued robustly, and once again till almost the onset of the recession.
The gains in stocks to a material extent are helped by the anticipation of a more accommodative monetary policy.
What Happens To Stocks This Time?
The weight of historical evidence suggests that stocks will continue with the existing trend, which is an uptrend. The negative spread on the 3/10 is by itself not a sufficient reason to anticipate the imminent expiration of the Bull Market. It suggests that a recession, which is a bull market assassin, is looming in the future. In addition, the spread crossover should be confirmed by the 2/10 spread. If the divergence persists, it will suggest some technical consideration at play.
Stocks typically continue their rally nearly up to the recession, even after the yield inversion. So the timing of the recession becomes very important, in being able to avoid losses that occur just as the recession is about to begin and then continue well into the recession. Incidentally, official recessions are cleanly identified well after they are over. It eventually comes down to investor judgment of when a recession begins.
At this time the softening of the global data has made the Federal Reserve quite sensitive to the rising risks for the US economy. The spread signal should now herald a shift in policy, where the playbook on rate hikes is now closed for 2019 and it is quite likely that the next policy move can be a rate cut or a quicker termination of the balance sheet normalization program. A more dovish Federal Reserve, a China trade deal, potential Chinese stimulus to boost the sagging domestic economy, and negative interest rate in Japan and Germany, are some of the factors that are positioned to support the global economy.
An economic expansion or a bull market being long on the tooth is not a reason for its demise. Below is a list of the longest global economic expansions, a little behind by 10 quarters but still relevant, which illustrates the point that a new expansion record doesn't mean the time has come for it to end.
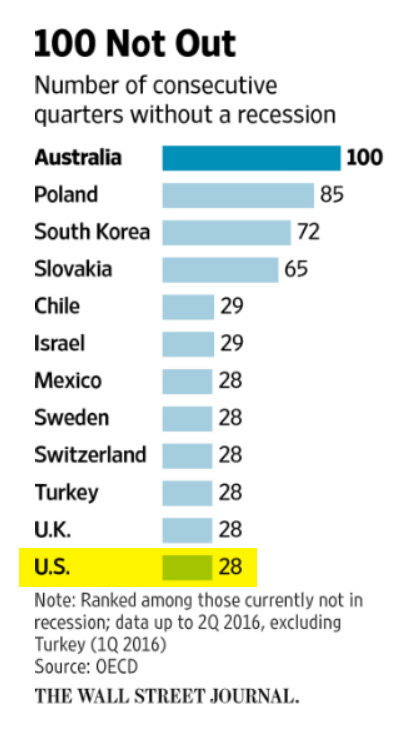
Longest Economic Growth
Conclusion
A yield inversion is a harbinger of a recession. But it doesn't imply a recession is imminent. There is a lag of a number of months following an inversion before the economy enters a recession, and a lot can happen to prolong this period of expansion.
What we can learn from historical evidence is that a natural tendency exists for stocks to continue on the present uptrend. We can witness a period of adjustment where slow economic data can cause an oversized reaction. But historically, stocks have continued to march higher till the eve of the recession. If indeed we are heading for a recession over the next 12 months, then we may also be entering a period of strong returns.
The spread indicator flashing a potential recession may require a portfolio adjustment but is surely not a call for abandoning stocks.