
- Small cap stocks record fresh all-time highs leading the broader market indexes higher for the first time in a couple of years
- Small cap performance suggests an underlying risk appetite in the market even with the volatility and yield-related concerns.
- Markets trends are reinforced not weakened when small caps are leading markets
- Small cap stocks have a long term track record of outpacing large caps
- A disciplined strategy with a prudent portfolio allocation to the small and mid cap segment can make a significant difference to long term returns
Finally, Small Caps Lead the Charge
It is the first time in over a year that small cap stocks have led the broader market to a new all-time high. This relative outperformance suggests something important.
Markets don’t turn over and change primary trends when small caps are making new all-time highs.
Small caps are a good barometer for risk appetite and the new highs indicate the presence of a broader willingness towards risk-taking. In a market jolted by volatility and living through an onerous and somewhat exaggerated fear of rising yields, the small-cap stocks are acquitting themselves better than their larger cap peers. As investors have become accustomed to a market being consistently led by a group of mega caps like Amazon (AMZN), Alphabet (GOOGL), Facebook (FB), Apple (AAPL), Netflix (NFLX), Nvidia (NVDA) and Microsoft (MSFT), the small cap rally being witnessed this month is a pleasant departure and provides a more democratic tenor to the bull market.
In the last 2 out of 3 years, small caps have been delivering a more muted performance, and it has been the larger-cap focused indexes like the S&P 500 (SPY) and Nasdaq (QQQ) that have outshined.
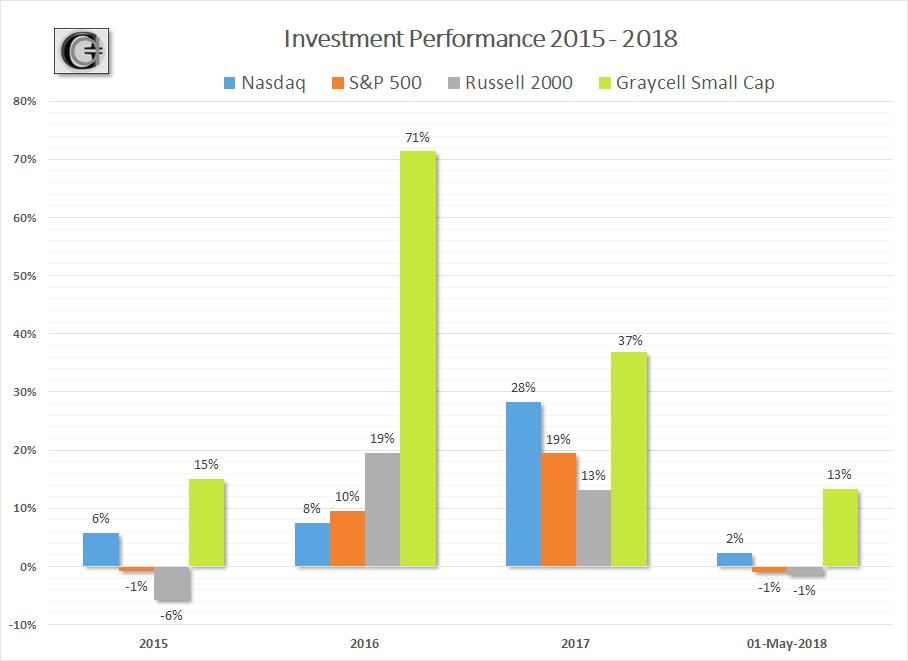
Investment Performance - Small Caps - 2015 - YTD2018
However, this is beginning to change.
Perhaps, a period of lagging performance could now be giving way to a reversion towards mean, whereby small cap indexes outperform for some time to come as they revert to their leadership position.
As we mentioned in our earlier article, Small Caps the Bright Spot, there are some unique aspects to small caps, which in the current environment are benefitting more directly than the larger cap stocks.
5 Reasons For Small Caps Improving Performance
First, the small cap companies have a more direct exposure to the fortunes of the US economy, relative to larger companies which typically have greater international exposure. According to S&P Dow Jones Indices, the small cap index, S&P 600, has a domestic US revenue exposure on an average of ~80%, compared to the ~70% exposure for the S&P 500 companies. The same is true for the industry's leading smallcap benchmark, the Russell 2000 (IWM) index. For the large cap constituents of the Dow Jones Industrial, Factset estimates the domestic revenue exposure to be even lower at ~62%.
The strong and stable US economy has consequently resulted in an earnings gush for small cap companies, exceeding even the record growth rates being recorded by S&P 500 companies of 25% in the first quarter, as per Factset.
Second, the tax cuts are having a more direct effect on small cap companies due to a greater proportion of their income being generated within the US, relative to larger cap peers. The Russell 2000 constituents paid a median tax rate of ~32% on the income. This was higher than the 28% paid by S&P 500 companies for 2017, and 24% for the Dow Jones Industrial constituents, as per Thomson Reuters. With the corporate tax rate reduced to 21% from the year 2018 onwards, the earnings impact on the income statements of small cap companies is more sizable compared to the larger cap multinational companies.
Third, the small caps are relatively less exposed to trade-related friction, when compared to larger cap stocks with substantial international presence and export revenues. However, if such friction and an initial volley of tariffs end up growing into a larger trade war, then the entire economy is affected and so will the small caps.
Fourth, the situation is now reversing from last year when a weaker dollar provided a relative boost to the earnings of larger cap companies with significant international revenues. Now the strengthening dollar over the past few weeks is creating a relative earnings advantage for small cap companies.
Finally, the smaller cap companies are attractive targets for acquisitions as a robust economy, capacity constraints, and easy credit enhances M&A as a growth strategy.
The new highs of the small cap indexes are reflecting the growing risk appetite of the market, which is being driven by strong earnings and bright economic prospects.
Enduring Power of Small Caps
Small-cap stocks are generally defined as companies with a market capitalization of between $250 million to $2 billion, but there are varying market cap ranges for the key small cap indexes.
The Russell 2000 index, the most popular small cap benchmark, does not use a market cap cutoff. Instead, the Russell 2000 index comprises the smallest 2000 companies in the Russell 3000 index, which in turn, comprises the largest 3000 US publicly-held companies representing 98% of the US stock market capitalization. Consequently, the average market cap and its range changes based on the overall market performance until June of each year when the Russell 2000 index is reconstituted.
As of April 30, 2018, the average market cap of Russell 2000 was $2.5 billion, the median (midpoint) was $860 million, and the highest market cap stock was $13 billion, which would be Nektar Therapeutics.
The S&P 600, another small cap index, is composed of 600 companies and as of April end had an average market cap of $1.4 billion, a median of $1.2 billion, and the highest market cap stock of $5 billion.
The Graycell Small Cap Portfolio uses a market cap range of $200 million to $3 billion at the time of investment in its model portfolio.
There has been abundant research over the years providing empirical evidence for the outperformance of small caps on both an absolute and risk-adjusted basis over time. The work of Nobel laureate Eugene Fama and many others have quite decisively concluded the outperformance of small cap companies compared to larger caps. To an extent, such outperformance depends on time frames, whereby in some periods small caps may outperform while underperforming in others. However, when measured over an extended period of time, the small cap outperformance is abundantly clear and consistent.
This outperformance of small caps versus large caps is quite vividly captured in the chart below which demonstrates the growth of $1 in various financial instruments from 1926 to 2016.
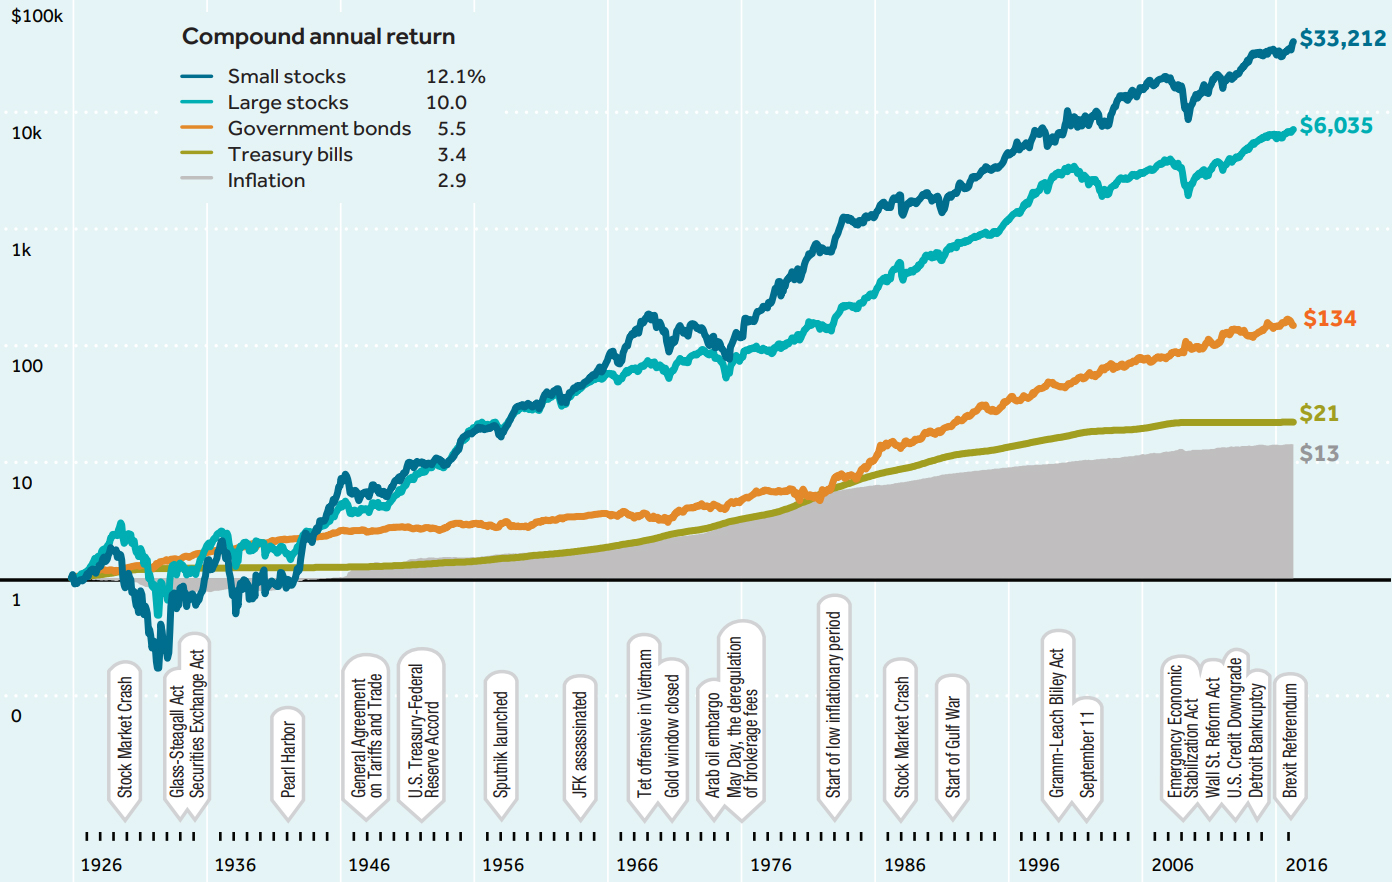
Performance of Financial Investments - 1926 to 2016 ~ Source: Morningstar
If investors are willing to bear the additional volatility and periodic underperformance of small cap stocks in the short-term, then over the long-term the portfolio is well-compensated for the additional risk. A prudent small cap portfolio approach must be considered to overcome some of the unique risks, while further improving the relatively higher small cap index returns.
Conclusion
At this time, small caps have momentum and sentiment in their favor, with the Russell 2000 having a strong month of May so far.
However, the principal reason to consider a consistent portfolio exposure to small caps is their enduring power to relatively outperform other stock market investment segments over time. If we look at the chart above, the additional return on the $1 from a superior investment class, compounds significantly over time and makes a big impact on the end outcome.
A disciplined strategy is essential to positioning a small cap portfolio for success and outperformance, and that has been the philosophy for the Graycell Small Cap portfolio.
As small caps take center stage there are a number of industries, from biotechs to technology, that are performing well. A few of the promising small cap and midcap names, some part of our model portfolios now or in the past, include Guess (GES), Carrizo Oil & Gas (CRZO), Fossil Group (FOSL), Heron Therapeutics (HRTX), Enova International (ENVA), Shutterfly (SFLY), Twilio (TWLO), Sarepta Therapeutics (SRPT), Mirati Therapeutics (MRTX), Endocyte (ECYT), Loxo Therapeutics (LOXO), W&T Offshore (WTI), Adaptimmune (ADAP), G1 Therapeutics (GTHX), Immunomedics (IMMU), Crispr Therapeutics (CRSP), Uniqure (QURE), Intelsat Global (I), Chegg (CHGG), GDS Holdings (GDS), Axon Enterprises (AXON), and Catalyst Biosciences (CBIO).
The article was first published on Seeking Alpha on May 22.