- Drawdowns are inevitable and more common than investors realize.
- Nearly two-thirds of the time a portfolio will be in a Drawdown, referred to as a State of Regret.
- Nearly 40% of the time, the Drawdown will be greater than 20%.
- Drawdowns can take a psychological toll and awareness of the likelihood of such Drawdowns can assist investors in making prudent investment decisions and managing the psychological impact.
Stock market investing is about reconciling to the fact that much of the time the portfolio will be in a state of drawdown, or below its high watermark. This is important for investors to recognize, for the drawdown can exert a substantial psychological toll on individual investors and can push them towards imprudent decisions or exit investing altogether. The discussion here is based on a highly insightful presentation by mathematician and former quantitative hedge fund manager Robert Frey in 2015, titled “180 Years of Market Drawdowns.”
Drawdown in investing measures the decline of a portfolio from its high point to its low point, before the portfolio recovers and makes another new high. In other words, it’s a peak-to-trough measurement. It is also important to understand the Drawdown Period, for a new Drawdown cannot occur till a new portfolio high is made. Often times the term high watermark is used. So a Drawdown period is a time from the first high watermark till the next one is achieved.

Calculating Drawdown
In the S&P 500 chart above, the Maximum Drawdown % is from the first highlight point down to the thick blue line, from A to C, while the Drawdown Period is the dotted line between two highlighted points A and B before a new high is made.
Key Insights
Frey studied the broader period of 180 years from 1835 to 2015, as well as the sub-periods up to pre-Depression, and the one following the World War II, using returns on the S&P 500 (SPY).
The insights are relatively stable and similar across the entire duration and segments.
There are 3 charts that we wish to highlight here from Frey's presentation.
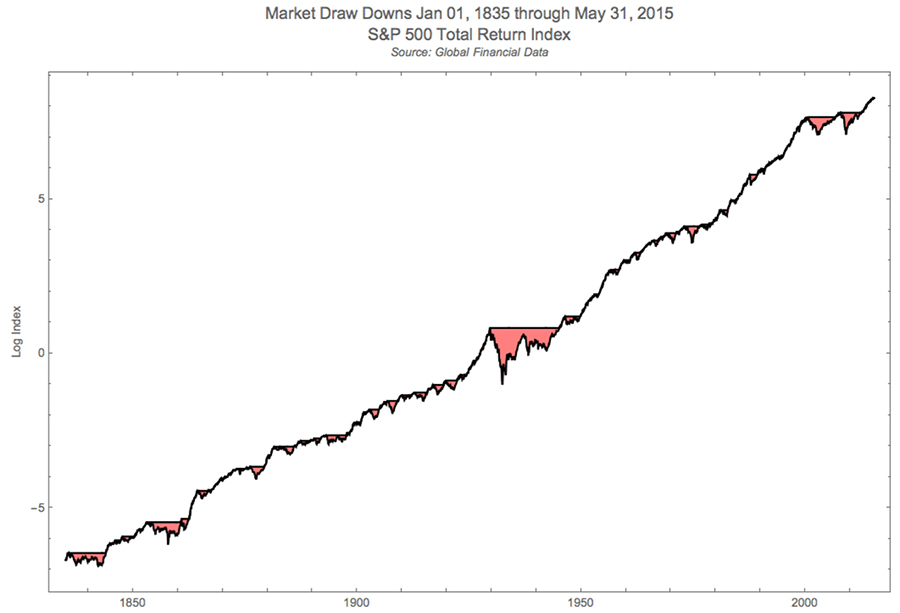
Source: 180 Years of Drawdowns by Robert Frey
As an investor, observing the chart above provides an impression that the best thing one can do is to invest in the stock market and leave the portfolio alone. There is a nice and steady positive slope of cumulative market returns. Well, broadly speaking that is true. There are Drawdowns, but they're overcome by the relentless march of the market higher over time, with time here being unending or infinite. So if the index is down today in the grips of a bear market, there is a high likelihood that with passing time, let's say 3 or 5 years from now, the index will be higher.
But this bird's eye view of the uptrend is over an extended period of 180 years, and it masks the punishing downturns or declines which are interspersed with fair regularity within the overarching trend. In the chart above, these Drawdown periods are marked in red with the most prominent red blushes being the Great Depression, the Dotcom Bubble Burst, and the Great Recession.
Another way to look at the Drawdowns on S&P 500 Total Returns over 180 years is shown in the chart below.
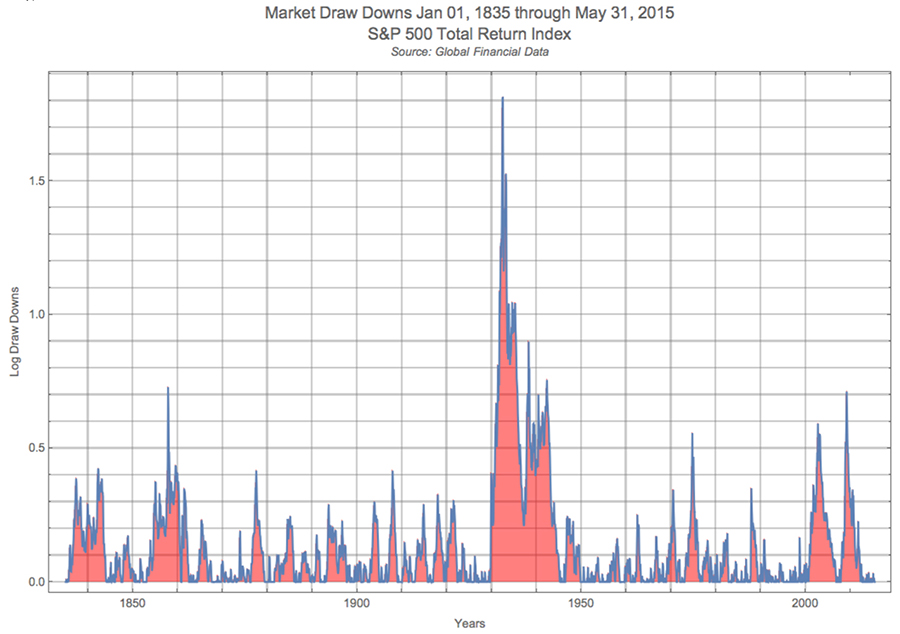
Source: 180 Years of Drawdown by Robert Frey
The chart presents the Drawdowns as they occurred in each period, with the complete blue lines representing states where the Drawdown was zero, something that would be encountered in a continuously rising market, and a mix of Pink and Blue representing states where the Drawdown was greater than zero, something that would be encountered in a declining market.
An insight that jumps out is that the period extending over 180 years is filled with Drawdowns.
The frequency of Drawdowns is much higher than one would imagine. In fact, it appears as if we are in some state of Drawdown most of the time. Sometimes it is big, sometimes small, but it is almost always there even in a market that is in a steady uptrend over an 180 year period.
This is a very important and relevant insight for investors to recognize. As Frey noted, investors "are usually in a Drawdown state even in a very good and positive investment."
But how often are these Drawdowns and how deep?
Frey studied different periods besides the 180-year time frame. The next chart shows the time frame from 1950 to 2015, a 65-year post-World War II period. We think this timeframe may be somewhat more relevant to present markets than the longer 180-year period, even though results do not change materially.
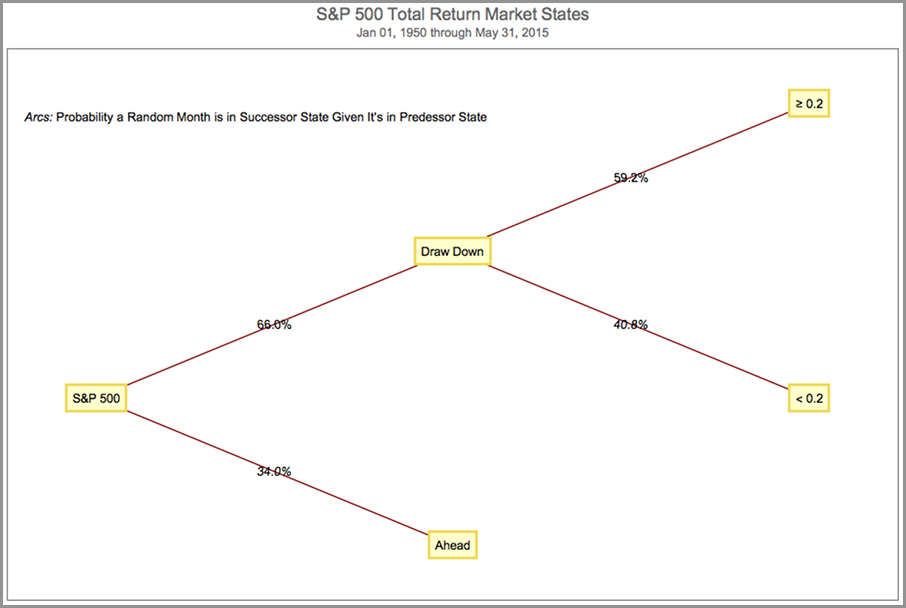
Source: 180 Years of Drawdown by Robert Frey
Based on the S&P 500 total return observations, Frey determined that nearly 66%, or two-thirds of the time, one spends in a Drawdown State or as he characterized in a "state of regret."This is a powerful insight.
The likelihood of our portfolio being below the high watermark at any time is 66%. Most investors, would not realize how often we are in a Drawdown state, even though they experience Drawdowns.
Frey's analysis frames the depth of such drawdowns and the insights are equally revealing.
Of the two-thirds time that an investor is in a Drawdown state, nearly 60% of that time is in a major Drawdown, defined by Frey as being more than a 20% decline. The remaining 40% of the time the investor is in a Drawdown state with a loss between 0% to 20%.
Thus, an investor will be in a major Drawdown state, an over 20% decline, nearly 40% of the time.
An important thing to note here is that over 180 years, or even periods before and after Great Depression, to avoid the huge distortion of Great Depression, the results are fairly similar. As Frey underscores in his presentation, this is a period where the financial system, the markets, the economy, the regulations, the industries, etc., have all been transformed many times. But what has remained constant is the extent of the Drawdown state. This is a very defining characteristic of the market; an insight into its nature.
There was a quick study done by Ben Carlson, CFA, of Wealth of Commonsense blog. Using the Robert Frey study as the basis, Carlson looked at the Drawdowns over the period 1927 to 2016 for S&P 500 monthly returns, and this is what he concluded:
"An investor would have been down from a prior peak over 70% of the time. The majority of your time invested in stocks could be spent thinking about how you coulda, shoulda, woulda sold at that previous high price (which of course gets taken out to the upside eventually)."
Carlson's breakdown of the Drawdown sizes is provided in the table below and shows that nearly 50% of the time an investor is in a Drawdown state of greater than 5%.
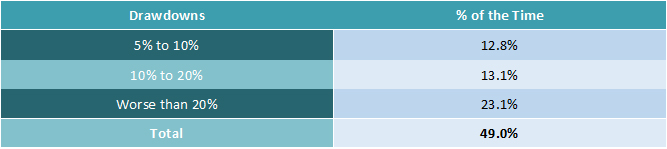
S&P 500 Drawdown - 1927 to 2016 - Monthly Returns ~ Source: Wealth of Common Sense
Implications for Individual Investors
The high probability of being in a Drawdown state has important implications for individual investors.
The psychological burden from the State of Regret, as Frey characterized, can be immense and can shape investor behavior. Going through a constant period of worry about Drawdowns and questioning the investments, can be hard on the mind. It can induce investors to engage in an imprudent behavior, like closing positions quickly or even retreating from the market after a period of agonizing Drawdowns, even though with time there portfolio may come out ahead.
It's interesting to note that Drawdowns have been one constant in the market amidst constant change. Perhaps, Drawdowns to some extent may represent investor nature, which does not change much from generation-to-generation.
New investors should be aware that the process of investing will encounter Drawdowns a majority of the time. It's not something that can be avoided. So with that perspective, the state of constant regret has to be managed. Drawdowns disappear with time or in other words, the portfolio eventually makes a new high watermark, and an investor with a long-term perspective should emerge fine from a Drawdown. But at times the Drawdown duration can be months or even worse years, and that can be a big psychological burden to carry for individual investors.
Furthermore, Frey's analysis has been on S&P 500 returns - which in a way we can view as a well-diversified portfolio of the largest companies in the US. We would tend to believe that a similar analysis performed on the kind of investing instruments available today would perhaps quite likely lead to a state of deeper and perhaps even more frequent Drawdowns; for example a Buy-and-Hold strategy with sector ETFs or personal portfolios of stocks which do not have similarly distributed industry diversification. In addition, such analysis on the S&P 500 has a survivor bias, which will also be reflected in analyses using other major indexes like Nasdaq (QQQ), Dow Jones Industrial Average (DIA), and Russell 2000 (IWM). While companies in a personal portfolio can go bankrupt in an adverse market cycle and disappear, leaving no equity to replace with a new position, in an index like S&P 500 companies can simply be replaced.
Conclusion
Being aware of how frequently a portfolio can be in a Drawdown state, even with blue-chip companies, can more effectively prepare investors to handle such Drawdowns, and manage the behavioral tendencies that can lead to imprudent decisions. Also, Drawdowns can be managed based on sell rules, like in quantitative model-driven systematic investing.
Drawdowns, by themselves, shouldn't scare investors, as a longer-term investor would usually come out okay, a fact observed from the first chart. The reference point of a previous high-water mark has to be longer-term. However, the interim period of Drawdowns can be psychologically enervating. If we recognize this as a characteristic of the market that is almost predestined, it will help us become more effective investors and prepare for such Drawdowns accordingly.
Please share your viewpoint below in the Comment section to assist other investors.
The article can also be viewed on Seeking Alpha.
As always, kindly do your own due diligence.
Earlier relevant articles and blog postings:
- Understanding Our Investing Biases - Part 1
- Understanding Our Investing Biases - Part 2