April 26, 2017
- Market professionals are suggesting an imminent correction for some time.
- Key measures are indicating overvaluation.
- But the market still marches on.
- Market Timing is a costly exercise, particularly for individual investors
- Staying the course has worked thus far
In our previous article, The Relentless Market And Missed Calls, we had highlighted how some of the leading money managers for many months have been calling for a market correction ranging from 5% to even 40%. To the chorus of such stock market correction calls can be added the notable voices of Scott Minerd, the chief investment officer of Guggenheim Partners which manages $260 billion, and billionaire investor Paul Tudor Jones who have voiced their concerns about an upcoming correction over Summer and Fall.
The market thus far can best be characterized as resilient over the past many months in the face of ominous correction warnings. The S&P 500 (SPY) is 1.5% off its high, while the Nasdaq (QQQ) is at its high. The Dow Jones Industrials (DIA) is regrouping close to its high, while the small cap Russell 2000 (IWM) remains in an extended consolidation mode for over 3 months.
If so many renowned money managers have been predicting a market correction, then why hasn't it already occurred? After all, there is sufficient negative news flow and some widely-followed equity gauges are on the overvalued side.
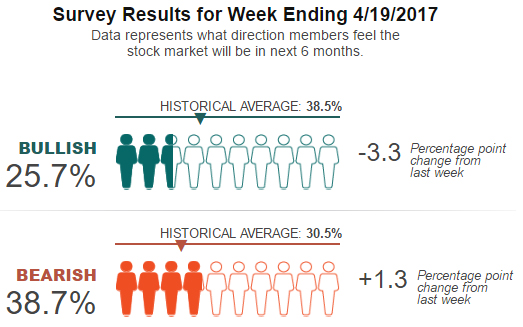
It seems nervousness is widespread, including the individual investors as shown in the survey below.
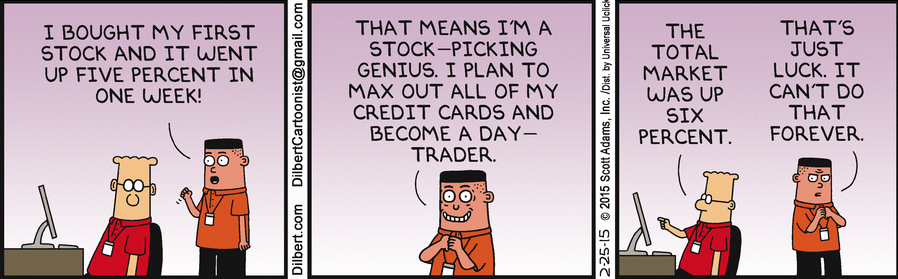
In our opinion, market timing is mostly a stroke of luck. When you hit it right, you feel like possessing a God's gift, till you simply miss the next call. History provides many such examples. It is just hard to be consistent at making sweeping market calls. One simply overestimates their ability to do that consistently.
On the other hand, for an individual investor, it is much easier to be consistent in their investment performance by following a disciplined approach to investing and benefitting from the longer term investment horizon ahead of them. Some of the best upswing days appear to occur during the period when people are worried about valuations, which curbs excesses and allows the market to climb the proverbial wall-of-worry.
Many of the money managers making such daring correction and bear market call also remain aware of the loss of returns that have been suffered by their peers who have made such bearish calls over the past many months, while the relentless market has chalked up new highs and continues to remain close to its highs.
As mentioned earlier, there is supporting evidence for a negative viewpoint. Traditional valuation benchmarks are higher than normal.
Total Market Cap to GNP
A gauge often cited to show the overvaluation of the market is the Total Market Cap to GNP, often referred to as the Buffett indicator. The legendary investor Warren Buffett in an interview in 2001 characterized it as the single best indicator to quickly gauge the market valuation at any given point, thus elevating the prominence it has received in investor analysis over the years. The chart below uses the Wilshire 5000, an acceptable proxy for the total market cap.
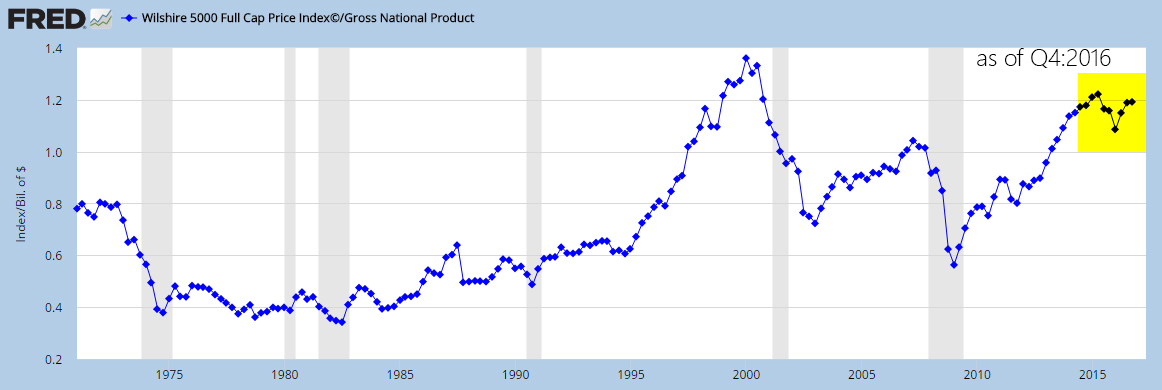
Market Cap to GNP ~ Source: Federal Reserve Bank of Saint Louis, FRED
This indicator has been moving higher.
A variant of it using the Total Market Cap to GDP is shown below.
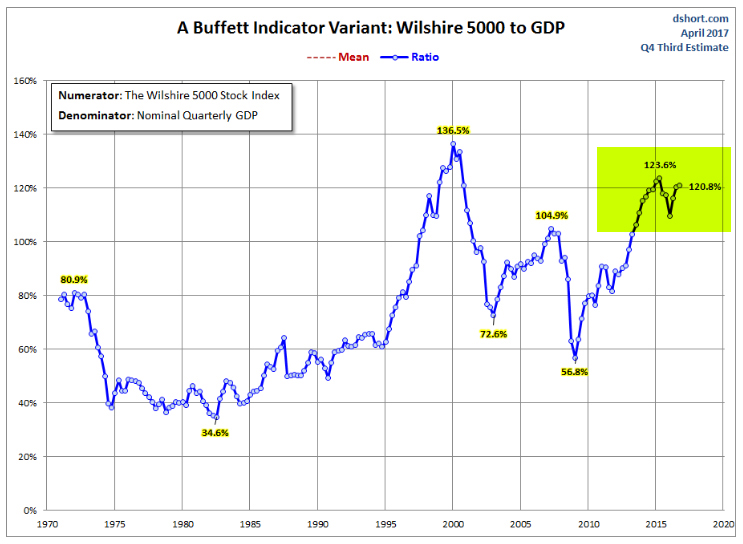
Total Market Cap (Wilshire 5000) to GDP ~ Source: Advisor Perspectives
It sure does look high when compared to the historical 45-year period. But by these measures, one would have been in high overvalued territory since 2012 when the indicator crossed the previous high level of 104.9% in 2008.
This indicator should not be confused as being a market timing tool.
Yes, it indicates the metric level is high. But it doesn't advise an exit, and neither does it advise the market can't go higher.
Interestingly, Warren Buffett, a few weeks ago, in a CNBC interview, characterized the market as "not in a bubble territory" and a fairly good investment if you have a longer-term horizon. It is not that he is unaware of where his preferred market indicator stands.
Price-to-Earnings
Another important indicator is the P/E valuation or its related scrubbed version, the CAPE Shiller P/E, which have both risen to their highest levels since the current recovery began. The Chart below shows the CAPE ratio for the S&P 500 companies.
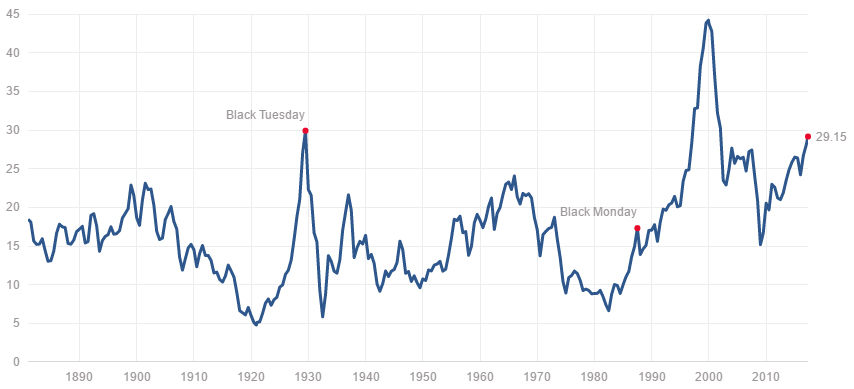
CAPE Shiller P/E ~ Source: Multpl.com
The PE expansion suggests a rising probability for a reversion to mean at some point in the future. But unfortunately, it doesn't tell us when. Just using this indicator to exit the market for it is above the mean and suggesting overvaluation, would have had investors out of the market for at least the last two-quarters. Looking at the mean Shiller P/E ratio of 17x over the entire term and comparing to the present level can be misleading, for accounting standards were quite different over this period.
Nonetheless, a higher reading than one over the last 10 years, can be suggestive that the time for aggressive portfolio building may be behind us. In other words, the early bird special is long gone. But it doesn't mean an immediate exit is necessary or the market cannot go higher. As the creator of CAPE, Yale University Professor Robert Shiller acknowledged in a CNBC interview six weeks ago,
[The high level of the indicator] is not suggesting, necessarily, any imminent disaster...in fact would suggest reducing your holdings of stocks, especially for a long-term investor. We can't time the market accurately, but we know that when it's this high, over the long term it usually doesn't do great."
However, investors would recognize that it is hard to predict when that long term would arrive and the markets will decline based on a high PE. The market trend can continue and the PE can become higher. An investor should be cautious but not necessarily on the sidelines with a high level of cash allocation if the only reason is a higher PE than the recent norm.
Earnings, Interest Rates and Economic Growth
In our previous articles on market valuation and outlook, written under the name Graycell Advisors, we have cited the three key essential props for the market - earnings, interest rates, and economic growth - that we focus on in determining our allocation. A more detailed discussion can be found in the article, Return of the Fundamentals.
While economic growth remains steady, the market this year has earnings momentum, as evidenced by the S&P 500. This appears to be continuing as first quarter earnings are being released. A blended earnings growth rate of 9.2% is anticipated for the first quarter earnings, which if it bears out will be the highest growth rate since 2011, as per Factset.
Interest rate policy remains benign. There is no evidence or reason that suggests a forcing of the Federal Reserve's hand in steepening its forecast of 3 rate increases in 2017. In fact, on the contrary, it is quite likely that the Federal Reserve may be cautious judging by the core Personal Consumption Expenditure (PCE) reading of 1.75% annual increase as of March 2017, and below the governing body's 2% target.
For the market to substantially decline into a deep correction or a bear market, we believe there have to be cracks in more than one of these somewhat related three underpinnings that support valuations.
It can well be that earnings for this quarter may underwhelm and not be above 9%. One can also believe that the economic policies and the tax plan being put forth by the administration may raise expectations of an inflation spike, thus accelerating the pace of interest rate increases.
These are risks that have to be monitored and stock allocation adjusted accordingly. But at this time, we are not there.
The Market Hour is not over yet!

As Buffett mentioned in the same February interview,
If the 10-year stays at 2.30% and it would stay there for 10 years, you would regret very much not having bought stocks now."
Now we don't know how long the 10-year bond would stay around 2.30% or similarly low levels. But the crux of the sage's comment is that valuations should also be viewed in the context of interest rate levels. A mild interest rate environment projects stocks as an attractive investment class.
As a side note, one has to wonder that with so many professional and individual market participants expecting a correction, when one does occur it may just give everyone a reason to get back into the market. Interestingly, it may lead to a relatively shallow and short-term correction. Of course, this assumes our 3 props are not falling apart.
Aren't We Market Timing?
In our January 2017 article on market outlook titled, "Still Waiting For A Correction? Market Outlook For 2017," we noted:
At this time, we believe the first-half will be better for stocks, than the second half, primarily because of fear of unrealized expectations. For the year, we believe the major indexes of S&P 500, Nasdaq, and small cap Russell 2000 to post double-digit gains...Till such time there is further evidence of this [policy] risk rising in probability, the prudent course is to stay invested."
Similarly, in our January 2016 article on market outlook titled, Viewpoint for 2016, it was noted:
We believe the decline and consolidation process to continue till February (2016), while March and April being the months when the market begins to consolidate and move higher...we believe a low-interest rate environment, a moderately growing economy, and rising payroll/consumer spending will deliver single-digit positive returns for both large-cap and small-cap indexes."
We are not really trying to time the market in our opinion above. We create a general framework of expectation to guide our investment allocation. As conditions evolve, we are free to change our opinion and recalibrate our allocation. This investing system is how we have guided our Graycell Small Cap Portfolio, which was up +71% in 2016, and our Prudent Biotech Portfolio.
We try to limit the behavioral risk of being wedded to our opinions, and let market data guide our monthly portfolio updates. Staying the course remains an optimal choice.
We recognize we will never be able to sell at the top. That's a risk of not pursuing market timing, which we have to live with.
As always, please conduct your own due diligence. Kindly feel free to add to this discussion or point out errors in the Comments section.
The post was first published on Seeking Alpha.