
- Earnings fountain created many opportunities in the first-half, even though index returns were relatively restrained.
- During the first-half, the market overcame a tide of negative sentiment, including a breaking down of trade alliances, the prospect of a trade war, an aggressive interest rate policy, and unending political turmoil.
- Second-half won’t be much different in terms of fear-inducing headlines and will also include the uncertainty of midterm elections in November.
- Staying the course for now with a stock allocation remains a reasonable investment strategy.
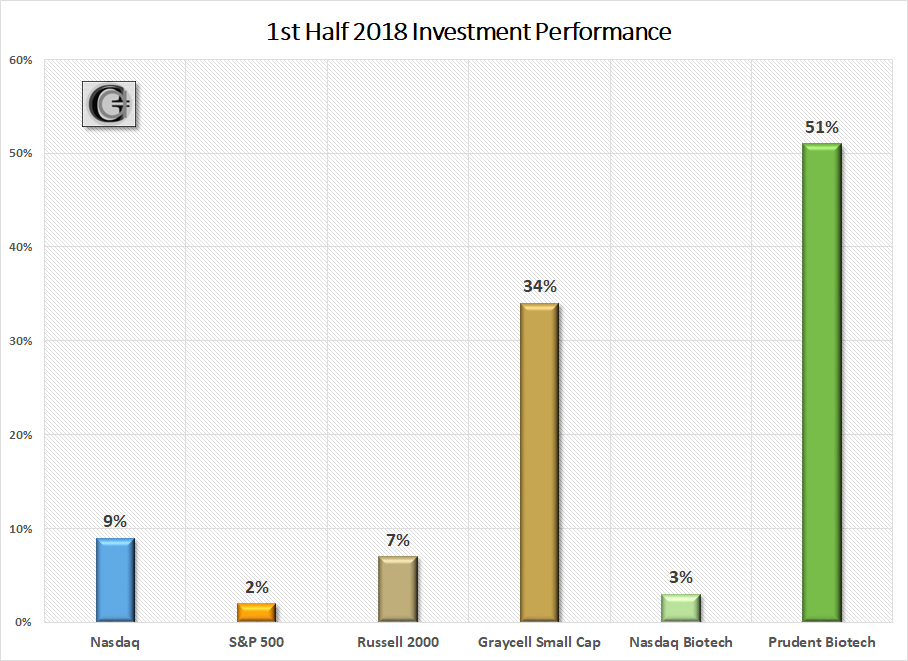
- The Prudent Biotech Portfolio gained +51% and the Graycell Small Cap gained +34% in the first-half. A tilt towards small and midcap stocks and a Biotech sector exposure remains an attractive investment opportunity.
Market Pulse

The stock market delivered many opportunities for a robust portfolio performance in the first-half. The major indexes delivered positive returns at a level which can track the average annual expected return of ~10%. The market rebound in the second quarter has been led by small caps, as reflected by the Russell 2000 (IWM) index which achieved an all-time high in May. The Nasdaq (QQQ) followed shortly with an all-time high in June. The S&P 500 (SPY) has lagged with a +2% gain in the first-half, and so has the Dow Jones (DIA) with a loss of -2%.
Small and midcap biotech stocks outperformed the larger caps. The large-cap weighted Nasdaq Biotechnology Index (IBB) was up +3%, and the smaller cap oriented S&P Biotech Select Index (XBI) gained +12%. The Prudent Biotech portfolio and the Graycell Small Cap outperformed their benchmark indexes.
The market gains can be more deeply appreciated when one recognizes the torrent of adverse news that the US stock market had to overcome. These included:
Monetary Policy.
The Federal Reserve conveyed through its dot-plot and commentary, a more aggressive tenor to the interest rate hiking policy.
Stronger Currency & Rising Rates.
The rising short-term rates and a stronger currency, which dilutes export earnings.
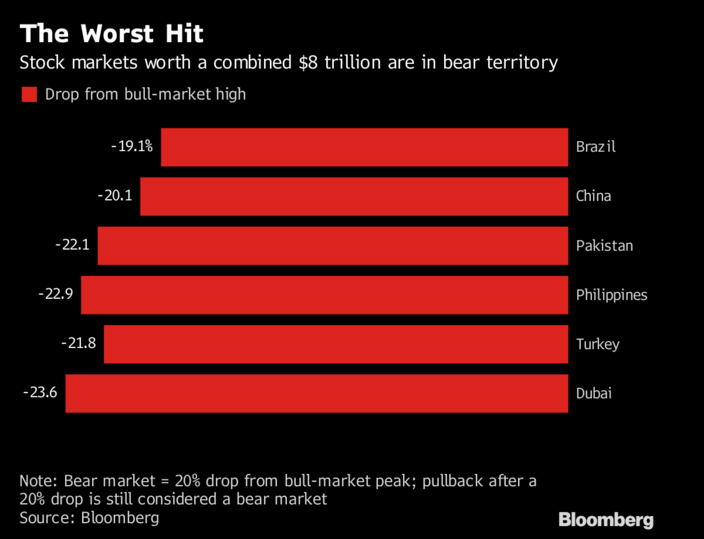
International Market Turmoil.
The US market has been a beacon of relatively stable gains as some key and emerging markets witnessed sharp declines. Even the EU Euro Stoxx 50 was down over -3% in the first-half.
Data as of last week of June 2018
Trade Friction.
The aggressive trade strategy adopted by the administration caught the market by surprise. The friction has continued to increase with all major trading partners, and the second-half will witness further challenges.
Geopolitical Issues.
The breaking-down of trade bloc relationships and stress on long-enduring alliances, the North Korean enigma, and the Iranian crisis are all issues that surfaced during the first-half and will persist during the second-half as well.
This was a lot to overcome and the stock market did that on the strength of the earnings and economy.
Earnings, Economy, and Monetary Policy

The key supports of stock market valuation are Earnings, Economy and the Federal Reserve Monetary Policy, all of which play a key role in an economic cycle and in determining stock valuations.
Of all the three, at this time the Monetary Policy is beginning to show growing risk, though still restrained, while the Earnings and Economy remain mostly in pristine condition but are expected to see rising challenges in the second-half due to dynamic administration policies. So the investing environment is transforming from last year when all three were highly favorable to stock valuations.
Earnings
The gush of first-quarter earnings assisted the stock market to climb a wall-of-worries. We have entered an environment where earnings are on a steep record-breaking ramp-up from the prior year. Earnings for S&P 500 companies grew by +25% over the prior year, and for this quarter, earnings are again expected to grow +20%. The second quarter earnings estimate for S&P 500 companies has risen at a pace not seen since Q2, 2010. Typically, bottom-up EPS declines during the quarter, as per Factset.
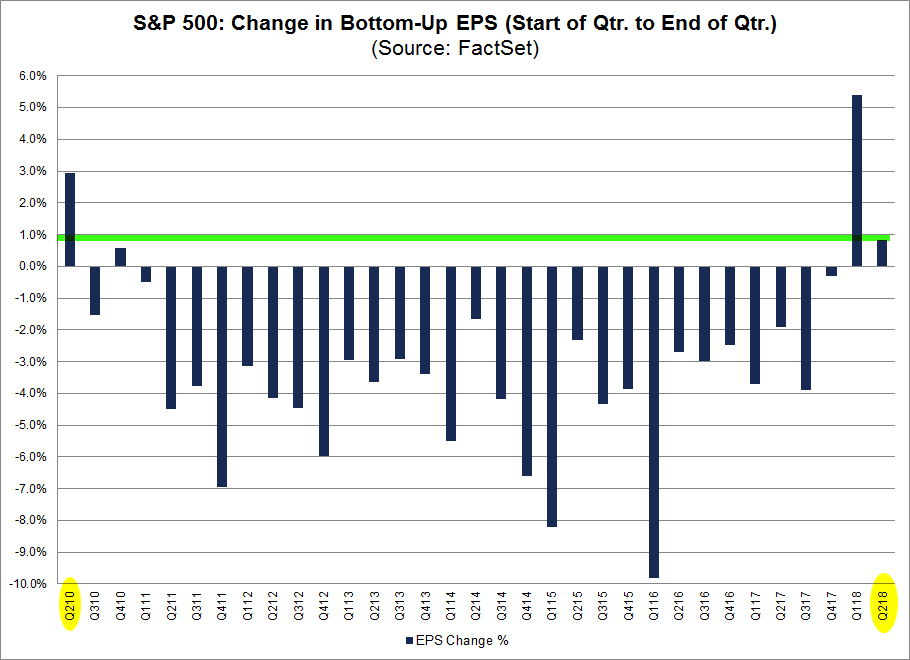
Source: Factset; emphasis by Graycell Advisors
The strong projected earnings growth has brought the S&P 500 twelve-month forward P/E multiple to the historical average of 16x, and to some extent eroding concerns of an overvalued market.
A critical data point that is expected to emerge later in June is the potential impact of trade friction and tariffs on earnings projections for the year. This is particularly important for industrial and export-oriented companies, like the many existing in the S&P 500 and Dow Jones index.
Economy
The economy remains in a pristine state with most key measures suggesting robust growth and diminished risk of a recession in the next 12 months. Consumer and business spending, drivers of the GDP, are both suggesting continued expansion, and drawing a pattern asymptomatic of an imminent slowdown in economic activity.
In the chart below, notice the flattening out of the Retail & Food Services Sales, a proxy for consumer spending, prior to the two recessions in this century. Such sideways pattern is not observable in the latest data with retail sales marking a new high in April data.
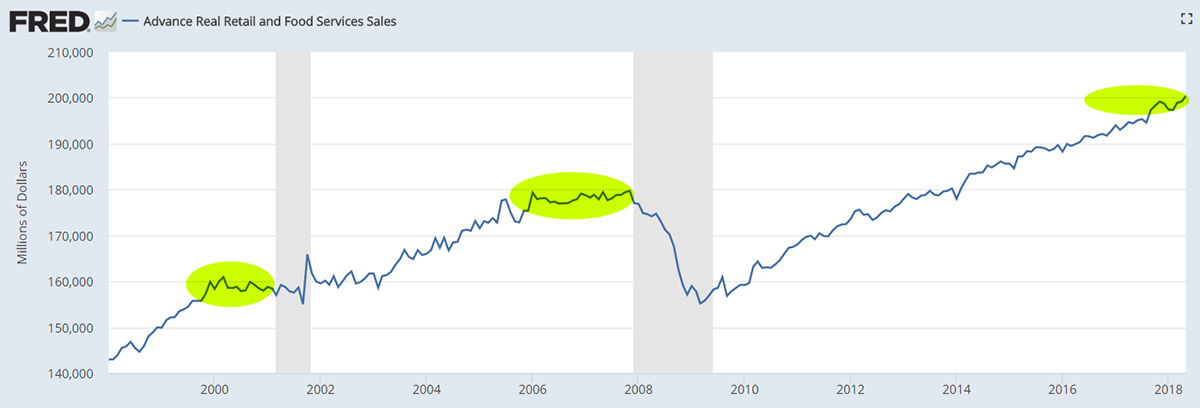
Consumer Spending ~ Source: FRB of St. Louis
When it comes to business spending, it turned around in late 2016 from its lagging performance since 2011, and the latest data shows it still trending higher and contributing to economic growth.
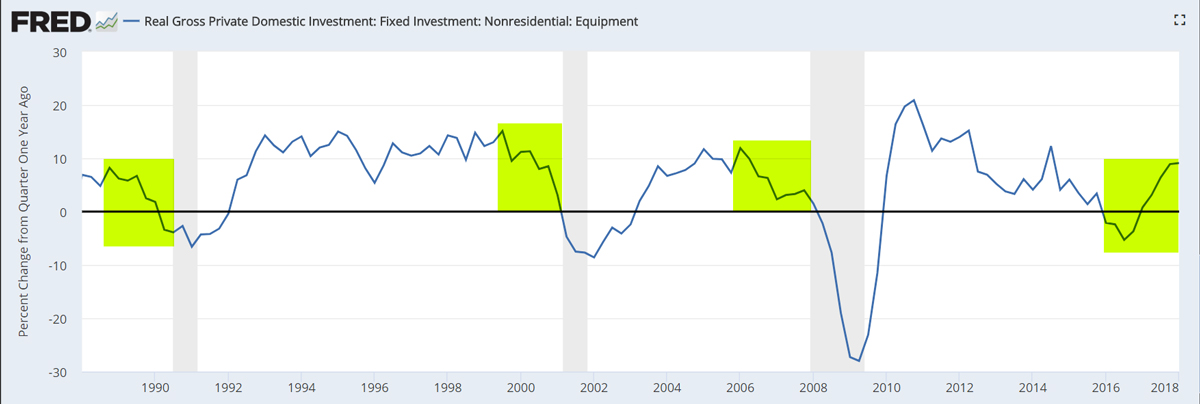
Business Spending ~ Source: FRB of St. Louis
The Federal Reserve Bank of Philadelphia maintains a Leading Index of economic activity, with a blended model of the coincident index as well as leading activities such as ISM delivery times, unemployment claims and interest rate spread between 10-year Treasury Bond and 3-month Treasury Bill. The change or growth in index activity begins to show material deterioration 3 to 9 months prior to a recession, based on the pattern observed over the past three recessions. As can be noted below, the index doesn't appear to be indicating any material deterioration.
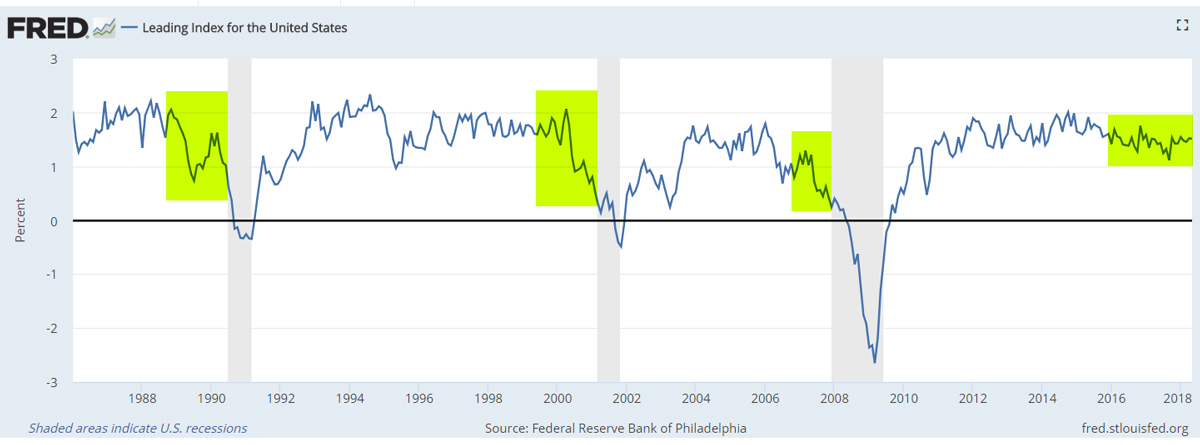
Leading Index ~ Source: FRB of St. Louis
All the above indicators suggest that an imminent recession, the primary reason for a bear market, is unlikely. But one must be aware that the indicators don't suggest that Corrections cannot occur, which can also be sharply volatile, stressful, and painful.
Monetary Policy
The Federal Reserve monetary policy can contribute to a contraction of an economic cycle through untimely rate increases that may prove to be aggressive in hindsight. Consequently, the recent rise in the projected rate increases this year from 3 to 4, conveyed through the dot plot, has given investors a case of rate anxiety as it suggests a tilt towards a more aggressive or hawkish posture. The highest number of dots, as highlighted below for 2018, indicates the choice receiving most support amongst the 15 FOMC participants, while the green line indicates the interest rate level of 2.25% to 2.5% for the most preferred choice
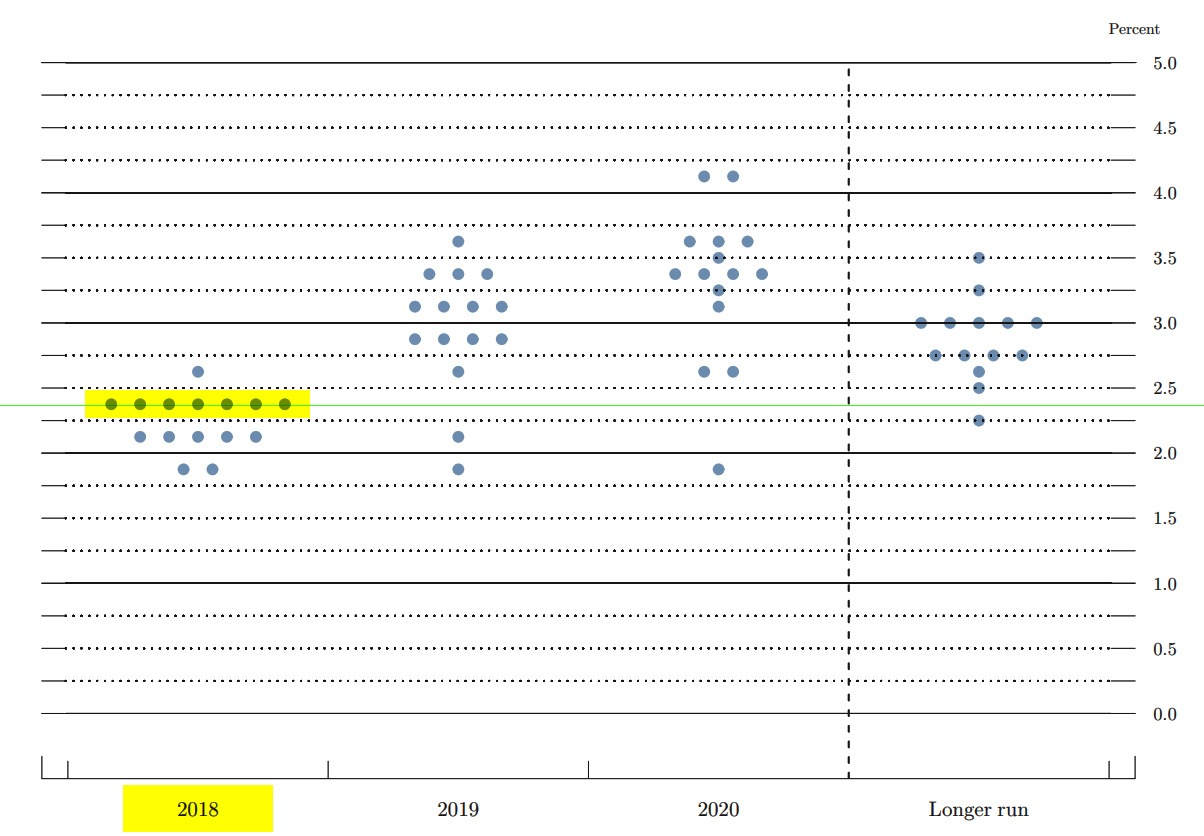
FOMC Dot Plot
There are a number of legitimate reasons to contribute towards a one-step bump in the Federal Reserve's expected interest rate path, and it should not be considered alarming from a stock investing standpoint. Rising inflation towards the 2% objective, a robust labor market combined with low unemployment, strong and steady economic growth, the ballooning federal deficits, and fiscal ($300 billion) and tax ($1.5 trillion) stimulus, are some of the urgent reasons that require a more hawkish, but measured, Federal Reserve response.
The Federal Reserve is not oblivious to the overall economic concerns, including a trade war and the compression of the long-and-short-term spreads which have a robust record of predicting recessions.
As discussed in our article, A Short Case For A Longer Term, the yield inversion indicator for recession is a well-respected leading economic indicator, followed closely even within the Federal Reserve, and has a reliable track record of predicting recessions. Each time the spread turns negative, a recession follows based on the historical pattern over more than 40 years.
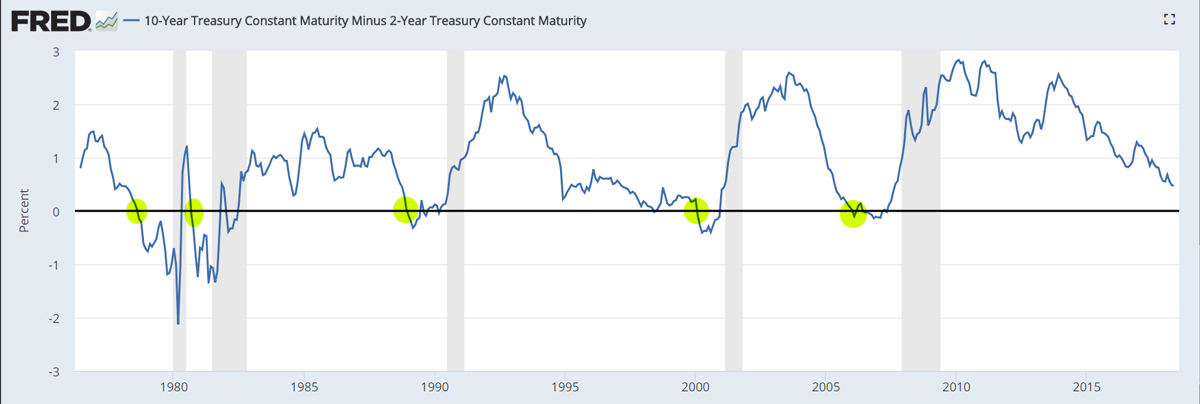
Yield Spread ~ Source: FRB of St. Louis
Even though the yield inversion indicator is a relatively reliable lighthouse bell alerting investors of a recession ahead, the economic downturn itself arrives with a considerable lag of 10 to 24 months, with a rough average of 16 months. The inversion should not by itself be a reason for investors to rush for the exits.
However, often there is a quick period of volatility or a Correction once the inversion occurs, before the stock market recovers and builds further gains over a period of time prior to the eventual recession.
Monetary policy is entering a new environment and this obviously has risks. But the Federal Reserve has shown restraint and a data-driven approach since the last recession. That policy should continue even with a new Chairperson at the helm, thus moderating the risk for investors of a premature economic slowdown.
Tariffs, An Unknown And Creeping Risk
The economic environment is facing a unique risk that has not been encountered in recent memory. A steady escalation of broad trade friction which can involuntarily escalate into a comprehensive trade war and recast economic relationships and outcomes.
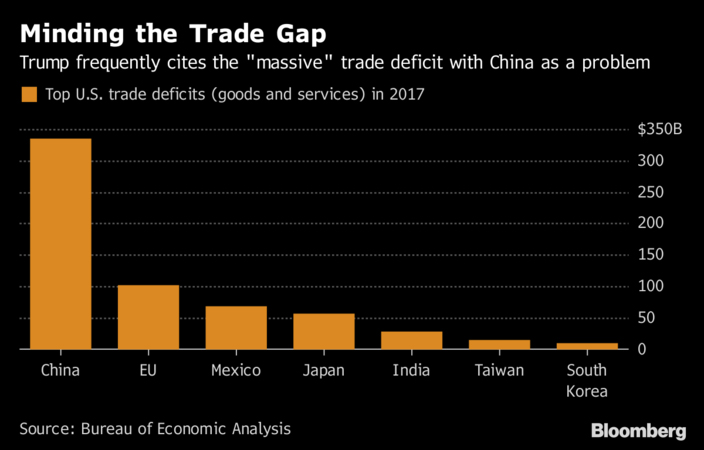
Source: Bloomberg
While the need for greater trade parity is a reasonable argument, there are economic implications with such a forced readjustment, both for the US and its trading partners.
Presently, the US is engaged in imposing tariffs on many key trading partners, who are in-turn retaliating. Where such a tariff war stops is uncertain?
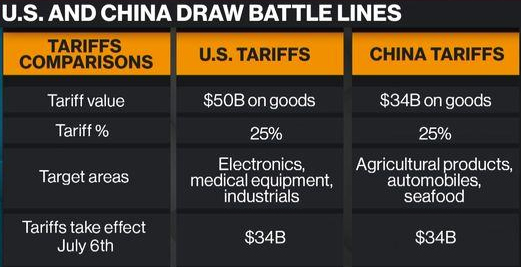
At the present time, the US economy can withstand the economic tremors from the present level of tariffs. But a prolonged trade war can disturb the economic and supply chain linkages with an adverse impact on inflation, corporate profitability, and global economic growth, thus transforming into an economic shock. That will not be good for the stock market. In fact, the long leash that the stock market has presently provided to the ongoing limited economic turbulence can turn tight very quickly if the situation continues beyond the third quarter. By that time the ramp-up of tariffs will begin to engulf hundreds of billions of dollars of global trade and possibly more than a trillion dollar before the year is up. In that case, there will be a higher cost to pay for such major trade dislocations.
The Federal Reserve will obviously keep the trade situation in mind as it continues to calibrate its interest rate policy. But trade dislocation fuels inflation and in a prolonged scenario, beyond this year, the central bank may discover its flexibility limited with regards to the interest rate policy.
And then there is North Korea, which remains a suspenseful situation with hard to predict outcomes. Whether there is even a partial meeting of the minds, if there can ever be, will determine if the geopolitical situation remains harmless or slides into a major market concern. And the situation should reach some outcome in this second-half of 2018.
Second-Half Outlook
In the 2018 Market Outlook, it was noted:
"During 2018, we believe the market will deliver returns in the 10-15% range for the major indexes. We anticipate a strong start to the year and believe the second-half will be more volatile"
As things stand presently, we still believe the year will most likely unfold in this manner, and the broader indexes should deliver double-digit gains in the 10% to 15% range. Staying the course and maintaining the stock allocations still appears to be the preferred investment strategy for capital gains.
We also believe that the second-half has the potential to be more volatile than the first-half, with key risks being the trade war, North Korea, and the outcomes from the November elections. The volatility has to be managed through an adjustment of the portfolio exposure as data evolves.
In the end, opinions can guide and provide a framework. The return is earned when the portfolio is appropriately positioned and adjusted, if required, based on market conditions.
Biotechs And Small Caps - Less Exposed To The Winds Of Tariff
When it comes to trade tariffs, the small cap and early mid cap stocks are relatively less exposed than larger caps, due to a lower proportion of international revenues which can be exposed to tariffs. Raw material exposure can though exist to some extent depending on the industries.
The biotech industry has little exposure to trade tariffs. Biotech research, for the most part, should remain unaffected by trade tariff issues. Smallcap and midcap biotechs have promising pipelines but no products that can come within the purview of tariffs. In addition, placing tariffs on biotech and pharmaceutical drugs is the least desirable option as it hurts the local population immediately and most directly where it counts - their health and wealth.
Consequently, we believe that biotechs, in particular, and small caps, in general, are relatively better positioned to withstand growing trade friction. However, they will not remain completely insulated from broader market declines as a result of trade friction, and from the ratcheting political rhetoric around drug prices as November mid-term elections approach.
Conclusion
The first-half is in the books, and it was a promising one for investors who were able to negotiate the volatility and stay positioned for opportunities. The second-half will require the same mettle of staying the course, but also recalibrating portfolio exposure as conditions warrant. It is our belief that as the third-quarter ages, the period from August to October will be a period of higher volatility. The dark horse is the outcome on the trade front. Any rapid resolution will catapult the market to new highs, as the earnings growth will finally begin to receive well-deserved higher multiples.
In the Prudent Biotech and the Graycell Small Cap model portfolios, we were fully invested entering July and will adjust the exposure as conditions evolve. Some of the promising midcap and smallcap companies, which may be now or in the past part of our model portfolios, include Immunomedics (IMMU), Ultragenyx Pharma (RARE), Etsy (ETSY), Loxo Oncology (LOXO), Turtle Beach (HEAR), Fossil Inc. (FOSL), Regenxbio (RGNX), California Resources (CRC), Sarepta Therapeutics (SRPT), TransEnterix (TRXC), Supernus Pharmaceuticals (SUPN), Shutterfly (SFLY), Mirati Therapeutics (MRTX), Chegg (CHGG), Endocyte (ECYT), GDS Holdings (GDS), Heron Therapeutics (HRTX), Twilio (TWLO), Arrowhead Pharmaceuticals (ARWR), Endo International (ENDP), Intercept Pharmaceutical (ICPT), Canada Goose (GOOS), Fibrogen (FGEN), Trade Desk (TTD), Acceleron Pharma (XLRN), and Neurocrine Biosciences (NBIX).
The article was first published on Seeking Alpha.